Note
Go to the end to download the full example code.
Mixed Poisson Process#
Simulate and visualise paths
# Author: Dialid Santiago <d.santiago@outlook.com>
# License: MIT
# Description: Simulate and visualise a Mixed Poisson Process

from aleatory.processes import MixedPoissonProcess
from aleatory.styles import qp_style
from scipy.stats import gamma

qp_style()  # Use quant-pastel-style


def intensity_gamma(a=1.0):
    g = gamma(a=a)
    return g.rvs()


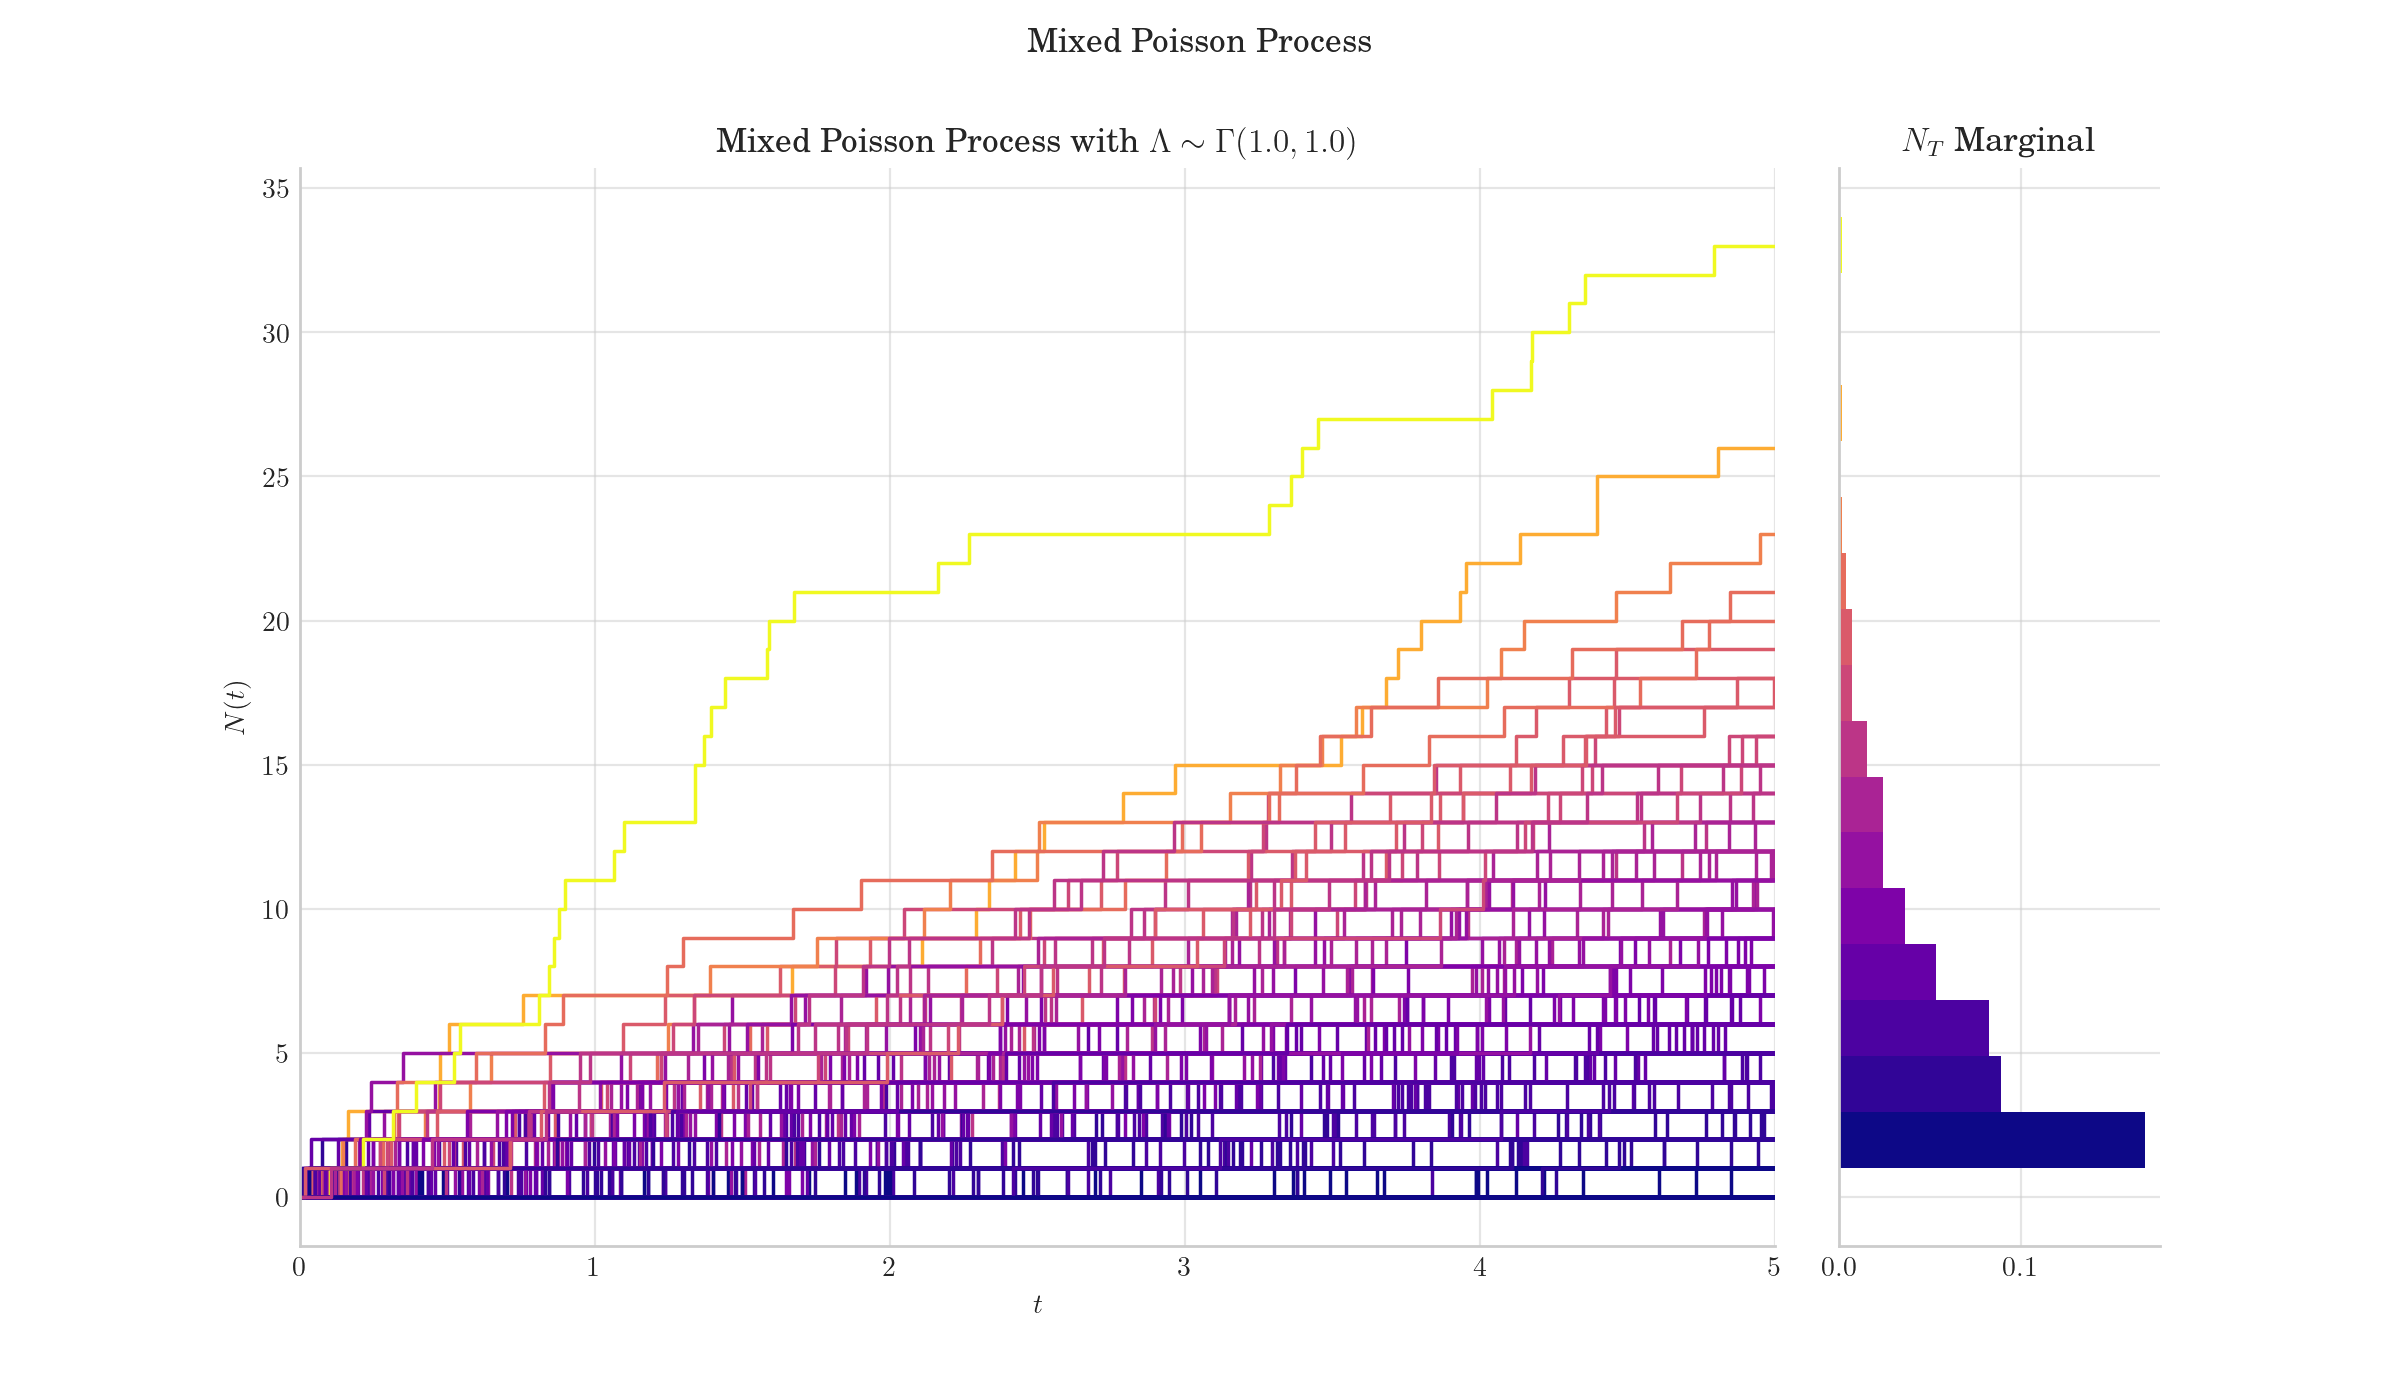
p = MixedPoissonProcess(intensity=intensity_gamma)
t = "Mixed Poisson Process with $\\Lambda \sim \Gamma(1.0, 1.0)$"
fig = p.draw(N=300, T=5.0, figsize=(12, 7), colormap="plasma", envelope=False, title=t)
fig.show()
p = MixedPoissonProcess(intensity=intensity_gamma, intensity_kwargs={"a": 3.0})
t = "Mixed Poisson Process with $\\Lambda \sim \Gamma(3.0, 1.0)$"
fig = p.draw(N=300, T=5.0, figsize=(12, 7), colormap="cool", envelope=False, title=t)
fig.show()
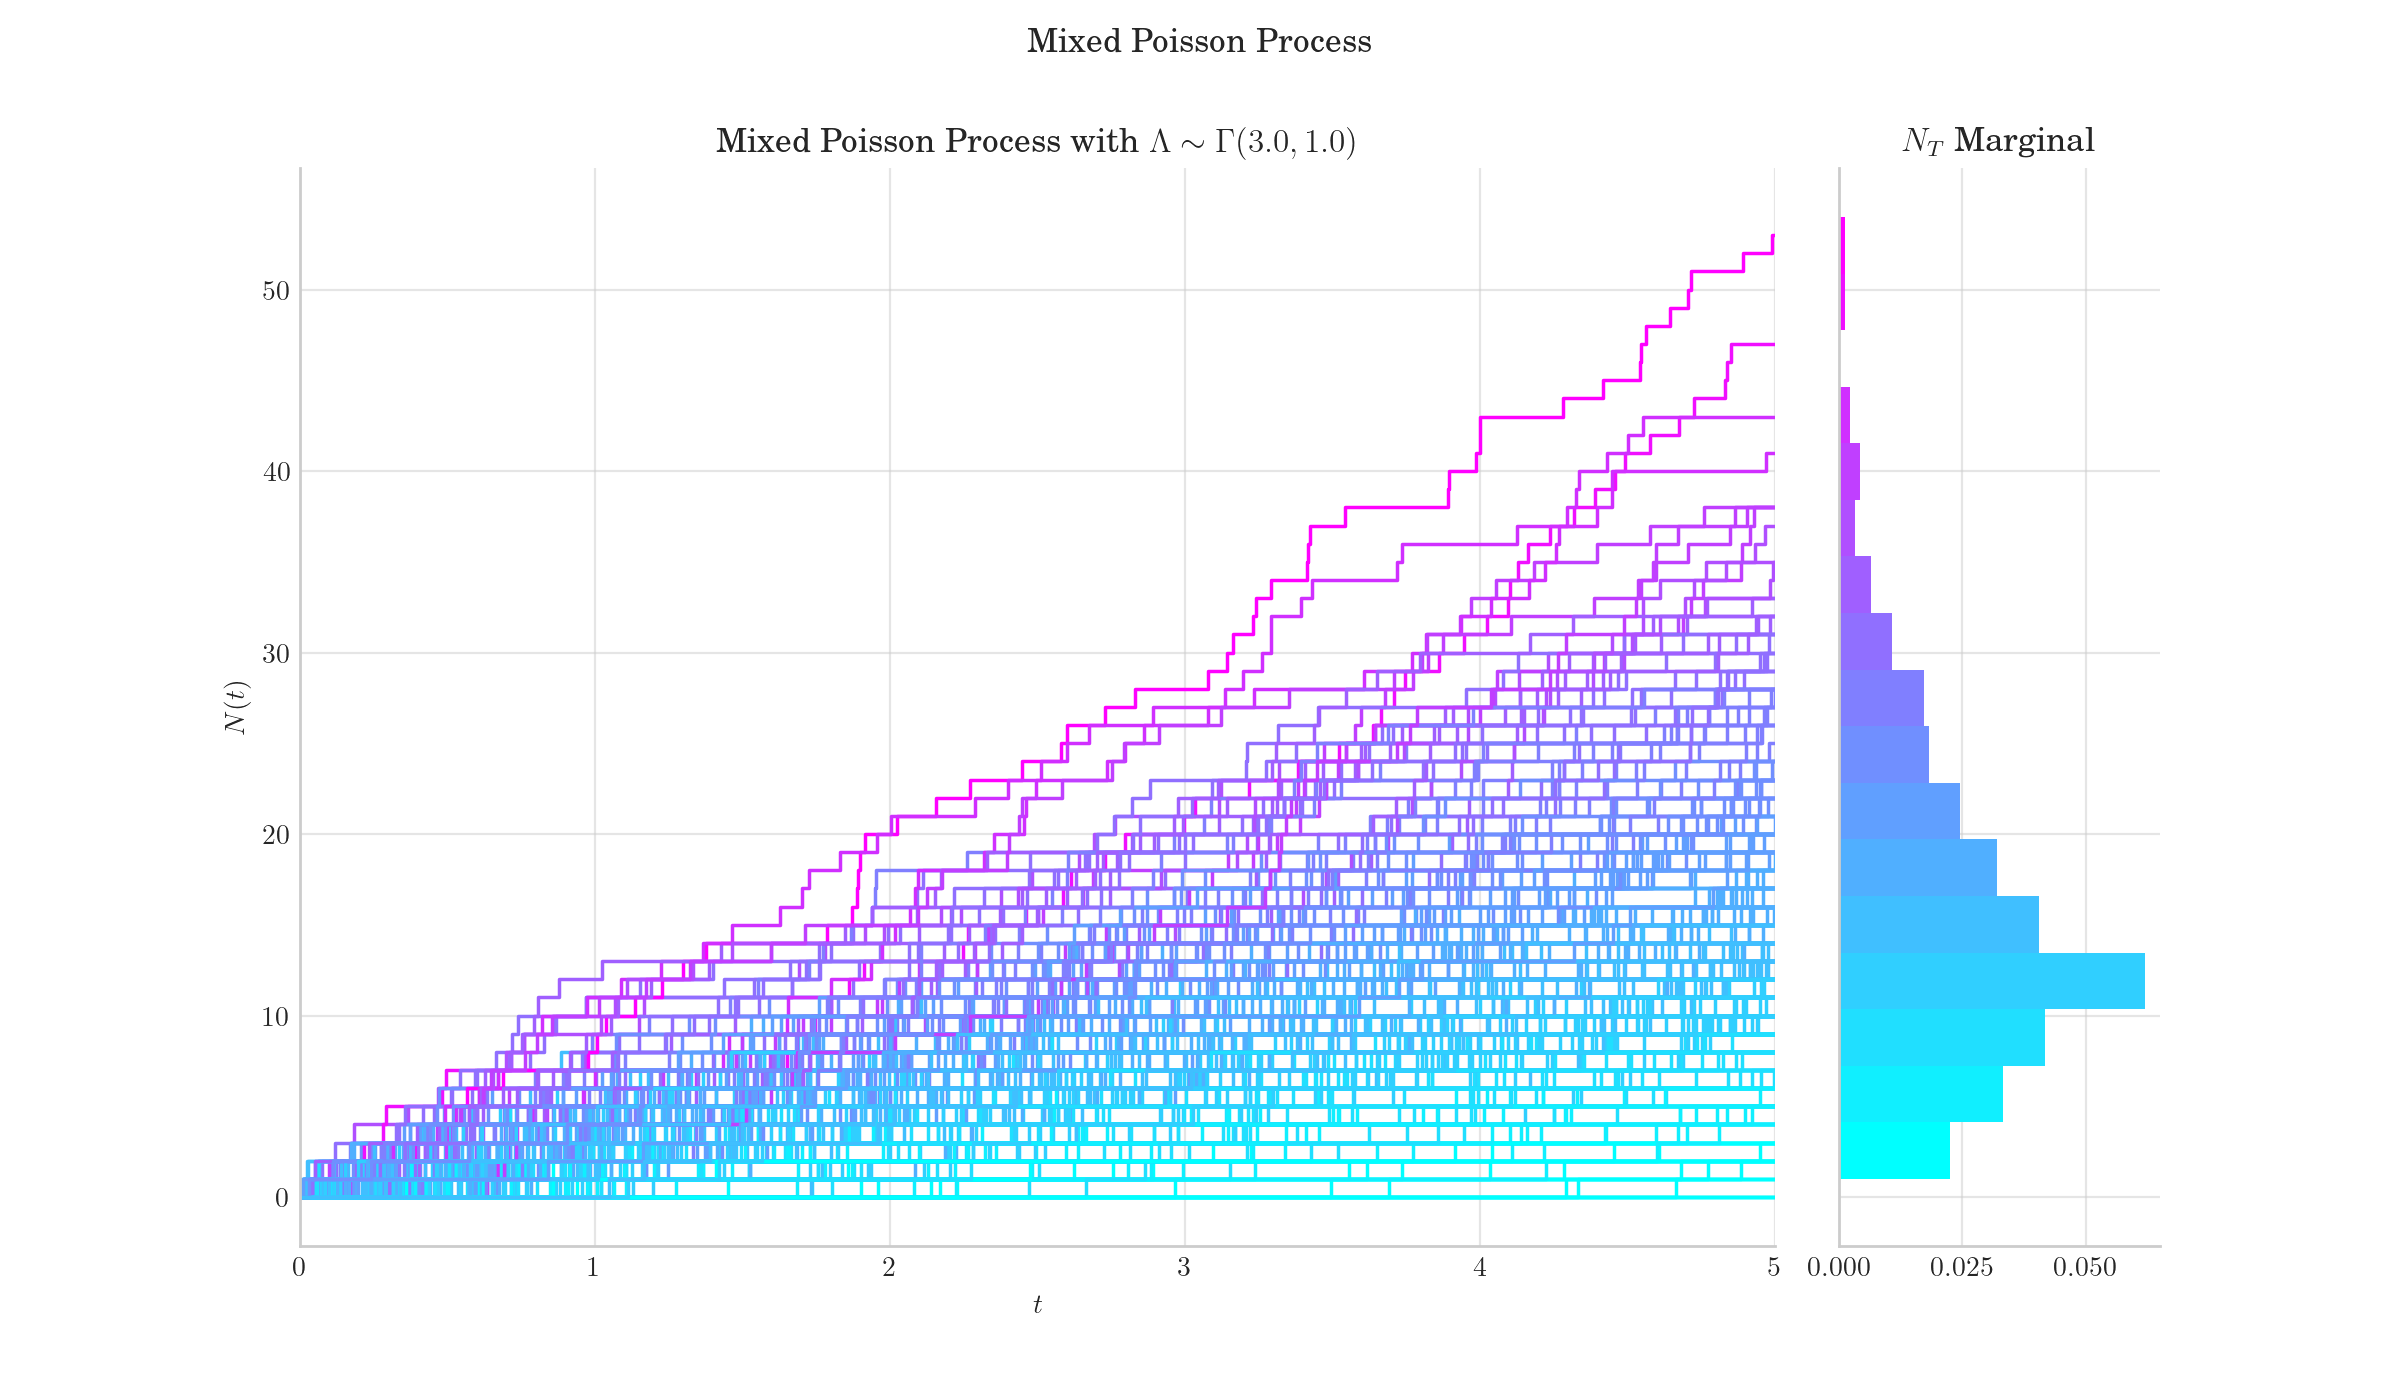
fig = p.plot(N=10, T=10, figsize=(12, 7), title=t)
fig.show()

Total running time of the script: (0 minutes 1.998 seconds)